

Learning Objectives
Examine how to do research in lifespan development
- Explain how the scientific method is used in researching development
- Compare various types and objectives of developmental research
- Describe methods for collecting research data (including observation, survey, case study, content analysis, and secondary content analysis)
- Explain correlational research
- Describe the value of experimental research
- Compare advantages and disadvantages of developmental research designs (cross-sectional, longitudinal, and cross-sequential)
- Describe challenges associated with researching lifespan development
How do we know what changes and stays the same (and when and why) in lifespan development? We rely on research that utilizes the scientific method so that we can have confidence in the findings. How data is collected may vary by age group and by the type of information sought. The developmental design (for example, following individuals as they age over time or comparing individuals of different ages at one point in time) will affect the data and the conclusions that can be drawn from them about actual age changes. What do you think are the particular challenges or issues in conducting developmental research, such as with infants and children?
An important part of learning any science, including psychology, is having a basic knowledge of the techniques used in gathering information. The hallmark of scientific investigation is that of following a set of procedures designed to keep questioning or skepticism alive while describing, explaining, or testing any phenomenon. Science involves continuously renewing our understanding of the subjects in question and an ongoing investigation of how and why events occur. The scientific method is the set of assumptions, rules, and procedures scientists use to conduct research.
Scientific Methods
The particular method used to conduct research may vary by discipline and since lifespan development is multidisciplinary, more than one method may be used to study human development. The scientific methods used in psychology are based on scientific thinking. Scientific reasoning involves forming hypotheses, following step-by-step processes to gather data that either describes or explains some phenomenon of human behavior or thinking, and then interpreting the data as evidence that supports or refutes the hypotheses.
One method of scientific investigation involves the following steps:
- Determining a research question
- Reviewing previous studies addressing the topic in question (known as a literature review)
- Determining a method of gathering information
- Conducting the study
- Interpreting the results
- Drawing conclusions; stating limitations of the study and suggestions for future research
- Making the findings available to others (both to share information and to have the work scrutinized by others)
The findings of these scientific studies can then be used by others as they explore the area of interest. Through this process, a literature or knowledge base is established. This model of scientific investigation presents research as a linear process guided by a specific research question. And it typically involves quantitative research, which relies on numerical data or using statistics to understand and report what has been studied.
Another model of research, referred to as qualitative research, may involve steps such as these:
- Begin with a broad area of interest and a research question
- Gain entrance into a group to be researched
- Gather field notes about the setting, the people, the structure, the activities, or other areas of interest
- Ask open-ended, broad “grand tour” types of questions when interviewing subjects
- Modify research questions as the study continues
- Note patterns or consistencies
- Explore new areas deemed important by the people being observed
- Report findings
In this type of research, theoretical ideas are “grounded” in the experiences of the participants. The researcher is the student and the people in the setting are the teachers as they inform the researcher of their world (Glazer & Strauss, 1967). Researchers should be aware of their own biases and assumptions, acknowledge them and bracket them in efforts to keep them from limiting accuracy in reporting. Sometimes qualitative studies are used initially to explore a topic and more quantitative studies are used to test or explain what was first described.
A good way to become more familiar with these scientific research methods, both quantitative and qualitative, is to look at journal articles, which are written in sections that follow these steps in the scientific process. Most psychological articles and many papers in the social sciences follow the writing guidelines and format dictated by the American Psychological Association (APA). In general, the structure follows: abstract (summary of the article), introduction or literature review, methods explaining how the study was conducted, results of the study, discussion and interpretation of findings, and references.
A research design is a specific method a researcher uses to collect, analyze, and interpret data. Psychologists use three major types of research designs in their research, and each provides an essential avenue for scientific investigation. Descriptive research is research that describes what is occurring at a particular point in time. Correlational research is research designed to discover relationships among variables and to allow the prediction of future events from present knowledge. Experimental research is research in which a researcher manipulates one or more variables to see their effects. Each of the three research designs varies according to its strengths and limitations.
Descriptive Research
Case Study
Sometimes the data in a descriptive research project are based on only a small set of individuals, often only one person or a single small group. These research designs are known as case studies which are descriptive records of one or a small group of individuals’ experiences and behavior. Sometimes case studies involve ordinary individuals. Developmental psychologist Jean Piaget observed his own children. More frequently, case studies are conducted on individuals who have unusual or abnormal experiences. The assumption is that by carefully studying these individuals, we can learn something about human nature. Case studies have a distinct disadvantage in that, although it allows us to get an idea of what is currently happening, it is usually limited to static pictures. Although descriptions of particular experiences may be interesting, they are not always transferable to other individuals in similar situations. They are also time-consuming and expensive as many professionals are involved in gathering the information.
Observations
Another type of descriptive research is known as observation. When using naturalistic observation, psychologists observe and record behavior that occurs in everyday settings. For instance, a developmental psychologist might watch children on a playground and describe what they say to each other. However, naturalistic observations do not allow the researcher to have any control over the environment.
Laboratory observation
Unlike naturalistic observation, laboratory observation is conducted in a setting created by the researcher. This permits the researcher to control more aspects of the situation. One example of laboratory observation involves a systematic procedure known as the strange situation test, which you will learn about in Chapter 3. Concerns regarding laboratory observations are that the participants are aware that they are being watched, and there is no guarantee that the behavior demonstrated in the laboratory will generalize to the real world.
Survey
In other cases, the data from descriptive research projects come in the form of a survey, which is a measure administered through either a verbal or written questionnaire to get a picture of the beliefs or behaviors of a sample of people of interest. The people chosen to participate in the research, known as the sample, are selected to be representative of all the people that the researcher wishes to know about called the population. A representative sample would include the same percentages of males, females, age groups, ethnic groups, and socioeconomic groups as the larger population.
Surveys gather information from many individuals in a short period of time, which is the greatest benefit of surveys. Additionally, surveys are inexpensive to administer. However, surveys typically yield surface information on a wide variety of factors but may not allow for an in-depth understanding of human behavior. Another problem is that respondents may lie because they want to present themselves in the most favorable light, known as social desirability. They also may be embarrassed to answer truthfully or are worried that their results will not be kept confidential. Additionally, questions can be perceived differently than intended.
Interviews
Rather than surveying participants, they can be interviewed which means they are directly questioned by a researcher. Interviewing participants on their behaviors or beliefs can solve the problem of misinterpreting the questions posed on surveys. The examiner can explain the questions and further probe responses for greater clarity and understanding. Although this can yield more accurate results, interviews take longer and are more expensive to administer than surveys. Participants can also demonstrate social desirability, which will affect the accuracy of the responses.
Psychophysiological Assessment
Researchers may also record psychophysiological data, such as measures of heart rate, hormone levels, or brain activity to help explain development. These measures may be recorded by themselves or in combination with behavioral data to better understand the bidirectional relations between biology and behavior. Special equipment has been developed to allow researchers to record the brain activity of very young and very small research subjects. One manner of understanding associations between brain development and behavioral advances is through the recording of event-related potentials (ERPs). ERPs are recorded by fitting a research participant with a stretchy cap that contains many small sensors or electrodes. These electrodes record tiny electrical currents on the scalp of the participant in response to the presentation of stimuli, such as a picture or a sound.
The use of ERPs has provided important insight as to how infants and children understand the world around them. Webb, Dawson, Bernier, and Panagiotides (2006) examined face and object processing in children with autism spectrum disorders, those with developmental delays, and those who were typically developing. The children wore electrode caps and had their brain activity recorded as they watched still photographs of faces of their mother or a stranger, and objects, including those that were familiar or unfamiliar to them. The researchers examined differences in face and object processing by group by observing a component of the brainwaves. Findings suggest that children with autism are in some way processing faces differently than typically developing children and those with more general developmental delays.
Secondary/Content Analysis
Involves analyzing information that has already been collected or examining documents or media to uncover attitudes, practices, or preferences. There are several data sets available to those who wish to conduct this type of research. For example, the U. S. Census Data is available and widely used to look at trends and changes taking place in the United States. The researcher conducting secondary analysis does not have to recruit subjects but does need to know the quality of the information collected in the original study.
Correlational Research
In contrast to descriptive research, which is designed primarily to provide static pictures, correlational research involves the measurement of two or more relevant variables and an assessment of the relationship between or among those variables. For instance, the variables of height and weight are systematically related (correlated) because taller people generally weigh more than shorter people.
Pearson Correlation Coefficient
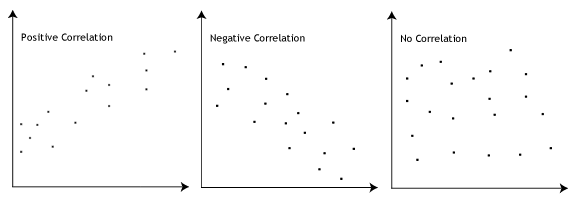
The Pearson Correlation Coefficient, symbolized by the letter r, is the most common statistical measure of the strength of linear relationships among variables. The value of the correlation coefficient ranges from r= –1.00 to r = +1.00. The strength of the linear relationship is indexed by the distance of the correlation coefficient from zero (its absolute value). For instance, r = –.54 is a stronger relationship than r= .30, and r = .72 is a stronger relationship than r = –.57. The direction of the linear relationship is indicated by the sign of the correlation coefficient. Positive values of r (such as r = .54 or r = .67) indicate that the relationship is positive (i.e., the pattern of the dots on the scatter plot runs from the lower left to the upper right), whereas negative values of r (such as r = –.30 or r = –.72) indicate negative relationships (i.e., the dots run from the upper left to the lower right).
When the straight line indicates that individuals who have high values for one variable also tend to have high values for the other variable, as in part (a), the relationship is said to be a positive correlation. Examples of positive correlations include those between education and income, and between age and mathematical abilities in children. In each case, people who score higher on one of the variables also tend to score higher on the other variable. A negative correlation, in contrast, as shown in part (b), occurs when high values for one variable tend to be associated with low values for the other variable. Examples of negative correlations include those between the age of a child and the number of diapers the child uses, and between practice and errors made on a learning task. In these cases, people who score higher on one of the variables tend to score lower on the other variable.
An important limitation of correlational research designs is that they cannot be used to conclude the causal relationships among the measured variables. Consider, for instance, a researcher who has hypothesized that viewing violent behavior will cause increased aggressive play in children. He has collected, from a sample of fourth-grade children, a measure of how much violent television each child views during the week, as well as a measure of how aggressively each child plays. The researcher discovers a positive correlation between the two measured variables. Although this positive correlation appears to support the hypothesis, it cannot be taken to indicate that viewing violent television causes aggressive behavior as there are other possible explanations. One alternative is that children who behaved aggressively at school want to watch violent television shows. Still another possible explanation for the observed correlation is that it has been produced by the presence of a third variable.
Problems with correlation
If generosity and happiness are positively correlated, should we conclude that being generous causes happiness? Similarly, if height and pathogen prevalence are negatively correlated, should we conclude that disease causes shortness? From a correlation alone, we can’t be certain. For example, in the first case, it may be that happiness causes generosity, or that generosity causes happiness. Or, a third variable might cause both happiness and generosity, creating the illusion of a direct link between the two. For example, wealth could be the third variable that causes both greater happiness and greater generosity. This is why correlation does not mean causation—an often repeated phrase among psychologists.
WATCH IT
In this video, University of Pennsylvania psychologist and bestselling author, Angela Duckworth describes the correlational research that informed her understanding of grit.
LINK TO LEARNING
Click through this interactive presentation to examine actual research studies.
TRY IT
Experimental Research
Experiments are designed to test hypotheses (or specific statements about the relationship between variables) in a controlled setting in efforts to explain how certain factors or events produce outcomes. A variable is anything that changes in value. Concepts are operationalized or transformed into variables in research which means that the researcher must specify exactly what is going to be measured in the study. For example, if we are interested in studying marital satisfaction, we have to specify what marital satisfaction really means or what we are going to use as an indicator of marital satisfaction. What is something measurable that would indicate some level of marital satisfaction? Would it be the amount of time couples spend together each day? Or eye contact during a discussion about money? Or maybe a subject’s score on a marital satisfaction scale? Each of these is measurable but these may not be equally valid or accurate indicators of marital satisfaction. What do you think? These are the kinds of considerations researchers must make when working through the design.
The experimental method is the only research method that can measure cause-and-effect relationships between variables. Three conditions must be met in order to establish cause and effect. Experimental designs are useful in meeting these conditions:
- The independent and dependent variables must be related. In other words, when one is altered, the other changes in response. The independent variable is something altered or introduced by the researcher; sometimes thought of as the treatment or intervention. The dependent variable is the outcome or the factor affected by the introduction of the independent variable; the dependent variable depends on the independent variable. For example, if we are looking at the impact of exercise on stress levels, the independent variable would be exercise; the dependent variable would be stress.
- The cause must come before the effect. Experiments measure subjects on the dependent variable before exposing them to the independent variable (establishing a baseline). So we would measure the subjects’ level of stress before introducing exercise and then again after the exercise to see if there has been a change in stress levels. (Observational and survey research does not always allow us to look at the timing of these events which makes understanding causality problematic with these methods.)
- The cause must be isolated. The researcher must ensure that no outside, perhaps unknown variables, are actually causing the effect we see. The experimental design helps make this possible. In an experiment, we would make sure that our subjects’ diets were held constant throughout the exercise program. Otherwise, the diet might really be creating a change in stress level rather than exercise.
A basic experimental design involves beginning with a sample (or subset of a population) and randomly assigning subjects to one of two groups: the experimental group or the control group. Ideally, to prevent bias, the participants would be blind to their condition (not aware of which group they are in) and the researchers would also be blind to each participant’s condition (referred to as “double blind“). The experimental group is the group that is going to be exposed to an independent variable or condition the researcher is introducing as a potential cause of an event. The control group is going to be used for comparison and is going to have the same experience as the experimental group but will not be exposed to the independent variable. This helps address the placebo effect, which is that a group may expect changes to happen just by participating. After exposing the experimental group to the independent variable, the two groups are measured again to see if a change has occurred. If so, we are in a better position to suggest that the independent variable caused the change in the dependent variable. The basic experimental model looks like this:
| Sample is randomly assigned to one of the groups below: | Measure DV | Introduce IV | Measure DV |
|---|---|---|---|
| Experimental Group | X | X | X |
| Control Group | X | – | X |
The major advantage of the experimental design is that of helping to establish cause-and-effect relationships. A disadvantage of this design is the difficulty of translating much of what concerns us about human behavior into a laboratory setting.
Research Involving Time-Spans
However, cross-sectional research does not allow the researcher to look at the impact of having been born in a certain time period, which is known as the cohort effect. For example, those born during the depression have very different views about and experiences with the internet than those born in the last twenty years. Different attitudes about the Internet, for example, might not be due to a person’s biological age as much as their life experiences as members of a cohort.
Longitudinal research
Longitudinal research involves studying a group of people who are the same age and measuring them repeatedly over a period of time. This type of design allows researchers to study individual differences in development. Longitudinal studies may be conducted over the short term, such as a span of months, or over much longer durations including years or decades. For these reasons, longitudinal research designs are optimal for studying stability and change over time.
Problems with longitudinal research include being very time-consuming and expensive. Researchers must maintain continued contact with participants over time, and these studies necessitate that scientists have funding to conduct their work over extended durations. An additional risk is attrition. Attrition occurs when participants fail to complete all portions of a study. Participants may move, change their phone numbers, or simply become disinterested in participating over time. Researchers should account for the possibility of attrition by enrolling a larger sample into their study initially, as some participants will likely drop out over time. Even with large sample size, the experimenter never knows if there was something different about the individuals who dropped out versus those that remained in the study.
The results from longitudinal studies may also be impacted by repeated assessments. Consider how well you would do on a math test if you were given the same exam every day for a week. Your performance would likely improve over time not necessarily because you developed better math abilities, but because you were continuously practicing the same math problems.
This phenomenon is known as a practice effect. Practice effects occur when participants become better at a task over time because they have done it again and again; not due to natural psychological development.
Cross-sequential research
Sequential research includes elements of both longitudinal and cross-sectional research designs. Similar to longitudinal designs, sequential research features participants who are followed over time; similar to cross-sectional designs, sequential work includes participants of different ages. This research design is also distinct from those that have been discussed previously in that individuals of different ages are enrolled into a study at various points in time to examine age-related changes, and development within the same individuals as they age, and account for the possibility of cohort effects
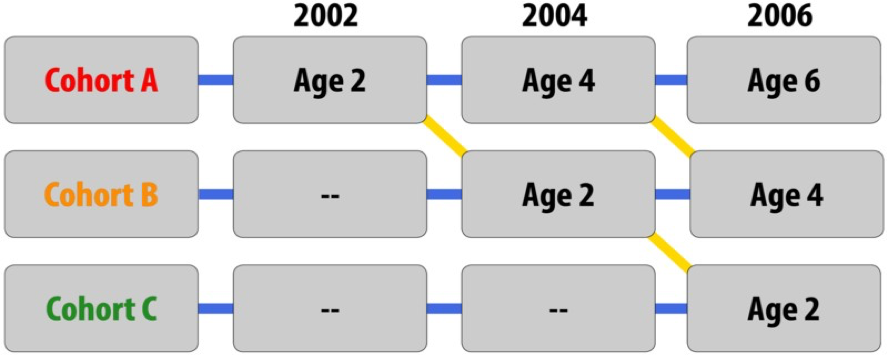
For example, in a study with a sequential design, a researcher might enroll three separate groups of children (Groups A, B, and C). Children in Group A would be enrolled when they are 2 years old and would be tested again when they are 4 and 6 years old. This is similar in design to the longitudinal study described previously. Children in Group B would also be enrolled when they are 2 years old, but this would occur two years later when Group A is now 4 years old. Finally, children in Group C would be enrolled when they are 2 years old and Group A is now 6 and Group B is now 4. At this time, the children would represent a cross-sectional design (2, 4, and 6 years of age). Further, along the diagonal children of the same age can be compared to determine if cohort effects are evident. Cross-sequential designs are appealing because they allow researchers to learn a lot about developmental changes that occur over time, and developmental variables can be measured and compared with differences between age and cohort groups.
Because they include elements of longitudinal and cross-sectional designs, cr0ss-sequential research has many of the same strengths and limitations as these other approaches. For example, cross-sequential work may require less time and effort than longitudinal research, but more time and effort than cross-sectional research. Although practice effects may be an issue if participants are asked to complete the same tasks or assessments over time, attrition may be less problematic than what is commonly experienced in longitudinal research since participants may not have to remain involved in the study for such a long period of time. The table below identifies advantages and disadvantages of each of the described time-span research designs.
| Advantages | Disadvantages | |
| Longitudinal |
|
|
| Cross-sectional |
|
|
| Cross-sequential |
|
|
Conducting Ethical Research
One of the issues that all scientists must address concerns the ethics of their research. Research in psychology may cause some stress, harm, or inconvenience for the people who participate in that research. Psychologists may induce stress, anxiety, or negative moods in their participants, expose them to weak electrical shocks, or convince them to behave in ways that violate their moral standards. Additionally, researchers may sometimes use animals, potentially harming them in the process.
Decisions about whether research is ethical are made using established ethical codes developed by scientific organizations, such as the American Psychological Association, and federal governments. In the United States, the Department of Health and Human Services provides the guidelines for ethical standards in research. The following are the American Psychological Association code of ethics when using humans in research (APA, 2016).
- No Harm: The most direct ethical concern of the scientist is to prevent harm to the research
- Informed Consent: Researchers must obtain informed consent, which explains as much as possible about the true nature of the study, particularly everything that might be expected to influence willingness to participate. Participants can withdraw their consent to participate at any point. Infants and young children cannot verbally indicate their willingness to participate, much less understand the balance of potential risks and benefits. As such, researchers are oftentimes required to obtain written informed consent from the parent or legal guardian of the child participant. Further, this adult is almost always present as the study is conducted. Children are not asked to indicate whether they would like to be involved in a study until they are approximately seven years old. Because infants and young children also cannot easily indicate if they would like to discontinue their participation in a study, researchers must be sensitive to changes in the state of the participant, such as determining whether a child is too tired or upset to continue, as well as to what the parent desires. In some cases, parents might want to discontinue their involvement in the research. As in adult studies, researchers must always strive to protect the rights and well-being of the minor participants and their parents when conducting developmental research.
- Confidentiality: Researchers must also protect the privacy of the research participants’ responses by not using names or other information that could identify the participants.
- Deception: Deception occurs whenever research participants are not completely and fully informed about the nature of the research project before participating in it. Deception may occur when the researcher tells the participants that a study is about one thing when in fact it is about something else, or when participants are not told about the hypothesis.
- Debriefing: At the end of a study, particularly one involving any form of deception, debriefing must occur. Debriefing is a procedure designed to fully explain the purposes and procedures of the research and remove any harmful after-effects of participation.