
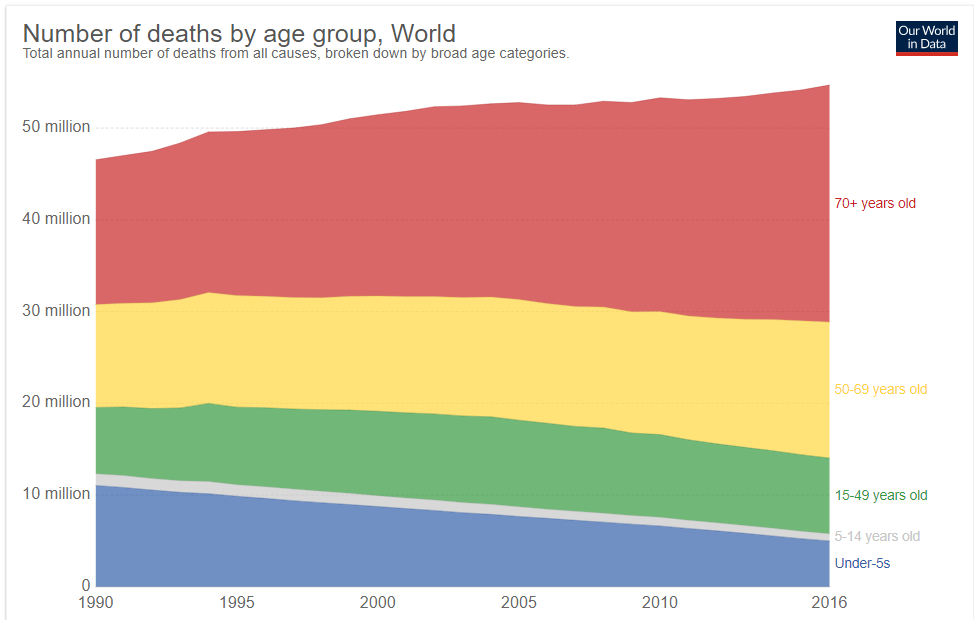
While death has always been a universal component in the human experience, its prevalence and circumstances have changed over the years. Today, we associate death with the elderly, but looking back even one hundred years ago, death was more common among children and in various age ranges. At that time, it was not uncommon for American families to lose a child during childbirth or infancy. Today less than 10% of all deaths worldwide occur to children under the age of 5, but as recently as 1990, that number was nearly 25%.
The graph above shows data from 2016, which reveal that nearly half of the 55 million global deaths occurred to those aged 70 years or older. There is still a great amount of disparity in death statistics based on location and access to medical care. In the United States, for example, deaths in that same age group of 70 years old or older accounted for 65% of total deaths. In this section, we’ll look more closely at the leading causes of death in the United States and throughout the globe.
Most Common Causes of Death
The United States
In 1900, the most common causes of death were infectious diseases, which brought death quickly. Due to advances in healthcare and medicine over the years, this has changed, alongside an increase in average life expectancy. According to national data, chronic diseases, or those in which a slow and steady decline causes health deterioration, were the most common causes of death in the United States in 2016 In addition, accidents were more common than in previous years, often resulting in quick or unexpected death. How might this impact the way we think of death, the way we grieve, and the amount of control a person has over his or her own dying process, in comparison to the infectious diseases that were prevalent in 1900?
The 15 leading causes of death and number of deaths per category in 2016 in the United States are listed below.
| Table 1. Leading Causes of Death in the United States |
|||
| Rank (2016) | Cause of Death | Percentage of total deaths 2016 | Percentage of total deaths 2015 |
| 1 | Heart disease | 23.1 | 23.4 |
| 2 | Cancer | 21.8 | 22.0 |
| 3 | Accidents | 5.9 | 5.4 |
| 4 | Chronic lower respiratory diseases | 5.6 | 5.7 |
| 5 | Strokes | 5.2 | 5.2 |
| 6 | Alzheimer’s Disease | 4.2 | 4.1 |
| 7 | Diabetes | 2.9 | 2.9 |
| 8 | Influenza and Pneumonia | 1.9 | 2.1 |
| 9 | Kidney Disease | 1.8 | 1.8 |
| 10 | Suicide | 1.6 | 1.6 |
These data reflect both similarities and differences when compared with data from 2004. All of these top causes of death, with the exception of two—accidents and suicides—continue to be related to physical illnesses. Many are linked at least in part to lifestyle choices, including diet, exercise, and substance abuse. Similarly, many are preventable, to some extent, and some are avoidable if the proper actions are taken. Although these causes of death remain the same as they were in 2004, the order has changed for several of them by 2016. For example, accidents and unintentional injuries shifted from #5 in 2004 to #3 in 2016. Alzheimer’s disease became slightly more common, moving from #7 to #6, as did suicide, moving from #11 to #10. In contrast, strokes became slightly less common, moving from #3 to #5, along with diabetes, which moved from #6 to #7. Septicemia (blood disease) followed a similar trend, shifting from #10 to #11. These changes are likely attributable to a variety of factors, including lifestyle choices, social pressures and norms, and changes in responsibilities and obligations
Deadliest Diseases Worldwide
The top 10 deadliest diseases in the world from 2015 are listed below, along with the percentage of deaths for which they were accountable. These reflect disease-related deaths only and do not reflect deaths due to violence or suicide. Notice there are several similarities between these and the top 15 causes of death in the United States described above.
- Heart disease – 15.5%
- Stroke – 11.1%
- Lower respiratory infections – 5.7%
- Chronic obstructive pulmonary disease – 5.6%
- Trachea, bronchus, and lung cancers – 3%
- Diabetes – 2.8%
- Alzheimer’s disease and other dementia – 2.7%
- Dehydration due to diarrheal diseases – 2.5%
- Tuberculosis – 2.4%
- Cirrhosis – 2.1%
Similar to the top 15 general causes of death listed above, these remained fairly consistent over the years, despite increases and decreases in each. Deaths caused by heart disease, for example, increased from 2000 by 2.8 million, and deaths caused by stroke increased by .5 million.[5] Lung disorders and cancers also rose by .5 million deaths, while diabetes rose by .6 million. Alzheimer’s disease and other forms of dementia also accounted for an additional .3 million deaths. Decreases were seen in lower respiratory infections, which decreased by .2 million, as well as dehydration due to diarrheal diseases, which decreased by .8 million. Furthermore, tuberculosis deaths decreased by 1 million, and cirrhosis deaths decreased by .2 million.
While the top 15 causes of death presented previously were only for the United States, these top 10 deadliest diseases are for the entire world, including both developed and undeveloped nations. Differences in various factors including but not limited to economic status, access to medical care, belief systems, and natural resources play a major role in many of these causes of death and tend to vary substantially between countries. This presents challenges for the interpretation of this list, making it difficult to determine the true prevalence of each in specific locations
A Comparison of Death by Age in the United States
The major causes of death vary significantly among age groups. As you can see in Figure 1, congenital diseases and accidents are major causes of death among children, then accidents and suicides are the leading causes of death between ages 10 and 24. This changes again into middle and late adulthood, as heart disease and cancer combined cause over 50% of deaths for those aged between 45 and 65.

Figure 2. Percent distribution of the 10 leading causes of death, by age group: the United States, 2016.
Notice that unintentional injuries are the leading cause of death for the widest variety of ages, and recall from the previous section above that accidents were also found to have become increasingly common as causes of death within the United States population between 2000 and 2016. These were the top causes of death for various age groups in the United States in the year 2016:
- < 1 year – Congenital anomalies
- 1 – 4 years – Unintentional Injury
- 5 – 9 years – Unintentional Injury
- 10 – 14 years – Unintentional Injury
- 15 – 24 years – Unintentional Injury
- 25 – 34 years – Unintentional Injury
- 35 – 44 years – Unintentional Injury
- 45 – 54 years – Malignant Neoplasms (cancer)
- 55 – 64 years – Malignant Neoplasms (cancer)
- 65 + – Heart Disease
The causes of death on this list resemble the causes presented in the previous sections, but the breakdown of these causes by age group highlights the true prevalence of each. Unintentional injury (accidents), for example, was found to be the third most common cause of death within the United States population, but it becomes apparent from this list that it is the most common for the widest range of age groups or developmental stages. Heart disease was found to be the most common cause of death overall, but this list shows that it is more restricted to one age group (65+) than other causes. Similarly, cancer was found to be the second most common cause of death within the United States population, but this list reveals that it is most prevalent for individuals in middle to late adulthood.
The Process of Dying
Aspects of Death
One way to understand death and dying is to look more closely at physiological death, social death, and psychological death. These deaths do not occur simultaneously, nor do they always occur in a set order. Rather, a person’s physiological, social, and psychological deaths can occur at different times.
Physiological death occurs when the vital organs no longer function. The digestive and respiratory systems begin to shut down during the gradual process of dying. A dying person no longer wants to eat as digestion slows, the digestive track loses moisture, and chewing, swallowing, and elimination become painful processes. Circulation slows and mottling, or the pooling of blood, may be noticeable on the underside of the body, appearing much like bruising. Breathing becomes more sporadic and shallow and may make a rattling sound as air travels through mucus-filled passageways. Agonal breathing refers to gasping, labored breaths caused by an abnormal pattern of brainstem reflex. The person often sleeps more and more and may talk less, although they may continue to hear. The kinds of symptoms noted prior to death in patients under hospice care (care focused on helping patients die as comfortably as possible) are noted below.
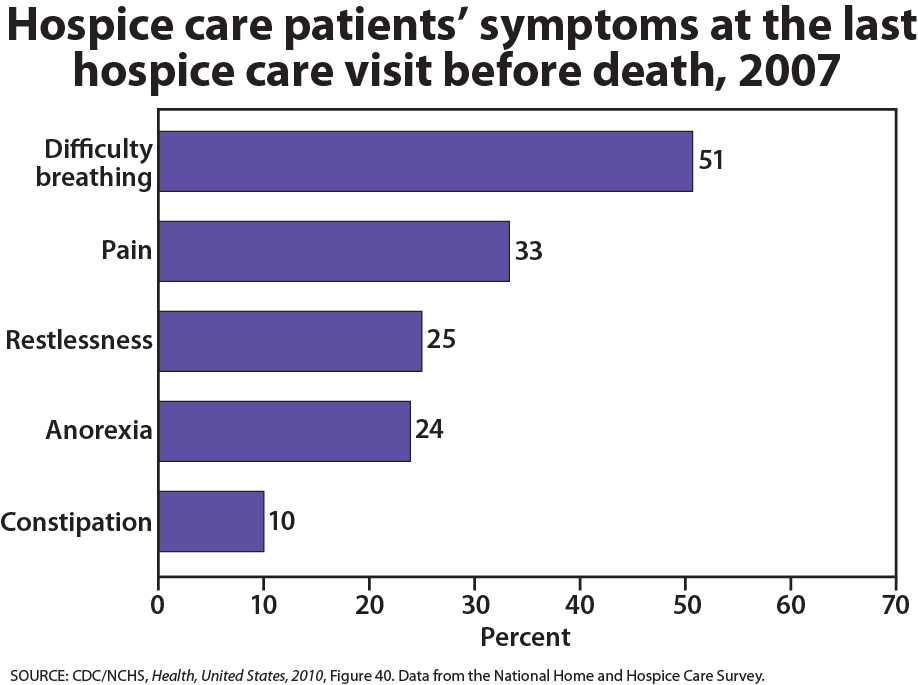
Figure 4. These are common symptoms reported prior, but close to, death.
When a person is brain dead or no longer has brain activity, they are clinically dead. Physiological death may take 72 or fewer hours. This is different than a vegetative state, which occurs when the cerebral cortex no longer registers electrical activity but the brain stem continues to be active. Individuals who are kept alive through life support may be classified this way.